Learning Objectives
In this section, students will:
5.1.1 – Recognize characteristics of parabolas.
5.1.2 – Understand how the graph of a parabola is related to its quadratic function.
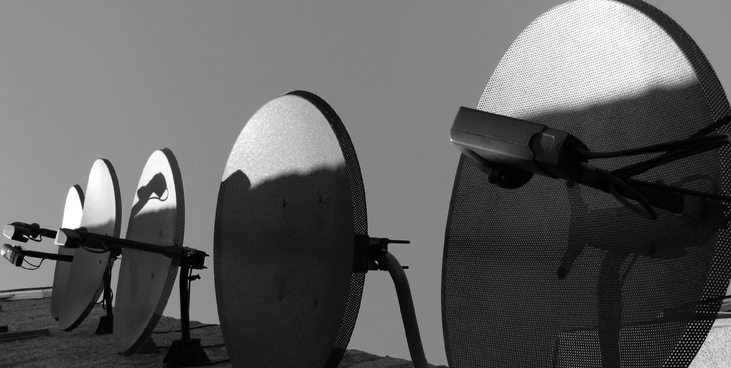
Curved antennas, such as the ones shown in (Figure), are commonly used to focus microwaves and radio waves to transmit television and telephone signals, as well as satellite and spacecraft communication. The cross-section of the antenna is in the shape of a parabola, which can be described by a quadratic function.
In this section, we will investigate quadratic functions, which frequently model problems involving area and projectile motion. Working with quadratic functions can be less complex than working with higher degree functions, so they provide a good opportunity for a detailed study of function behavior.
Recognizing Characteristics of Parabolas
The graph of a quadratic function is a U-shaped curve called a parabola. One important feature of the graph is that it has an extreme point, called the vertex. If the parabola opens up, the vertex represents the lowest point on the graph, or the minimum value of the quadratic function. If the parabola opens down, the vertex represents the highest point on the graph, or the maximum value. In either case, the vertex is a turning point on the graph. The graph is also symmetric with a vertical line drawn through the vertex, called the axis of symmetry. These features are illustrated in (Figure).
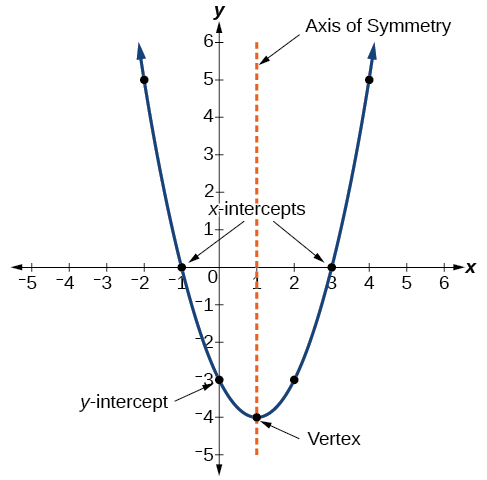
The y-intercept is the point at which the parabola crosses the y-axis. The x-intercepts are the points at which the parabola crosses the x-axis. If they exist, the x-intercepts represent the zeros, or roots, of the quadratic function, the values of [latex]\,x\,[/latex] at which [latex]\,y=0.[/latex]
Example 1 – Identifying the Characteristics of a Parabola
Determine the vertex, axis of symmetry, zeros, and [latex]\,y\text{-}[/latex] intercept of the parabola shown in (Figure).
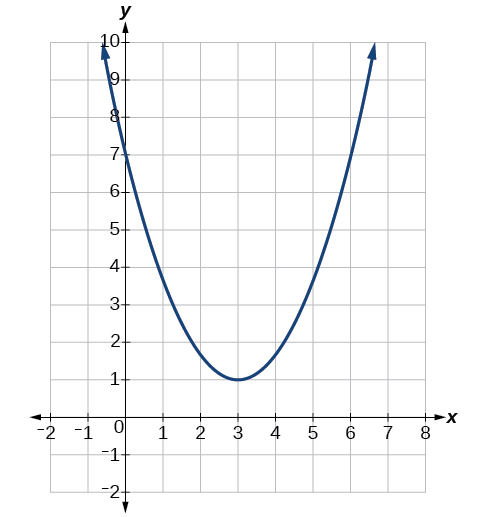
The vertex is the turning point of the graph. We can see that the vertex is at [latex]\,\left(3,1\right).\,[/latex] Because this parabola opens upward, the axis of symmetry is the vertical line that intersects the parabola at the vertex. So the axis of symmetry is [latex]\,x=3.\,[/latex] This parabola does not cross the [latex]\,x\text{-}[/latex] axis, so it has no zeros. It crosses the [latex]\,y\text{-}[/latex] axis at [latex]\,\left(0,7\right)\,[/latex] so this is the y-intercept.
Understanding How the Graphs of Parabolas are Related to Their Quadratic Functions
The general form of a quadratic function presents the function in the form
where [latex]\,a,b,\,[/latex] and [latex]\,c\,[/latex] are real numbers and [latex]\,a\ne 0.\,[/latex] If [latex]\,a>0,\,[/latex] the parabola opens upward. If [latex]\,a<0,\,[/latex] the parabola opens downward. We can use the general form of a parabola to find the equation for the axis of symmetry.
The axis of symmetry is defined by [latex]\,x=-\frac{b}{2a}.\,[/latex] If we use the quadratic formula, [latex]\,x=\frac{-b\pm\sqrt{{b}^{2}-4ac}}{2a},\,[/latex] to solve [latex]\,a{x}^{2}+bx+c=0\,[/latex] for the [latex]\,x\text{-}[/latex] intercepts, or zeros, we find the value of [latex]\,x\,[/latex] halfway between them is always [latex]\,x=-\frac{b}{2a},\,[/latex] the equation for the axis of symmetry.
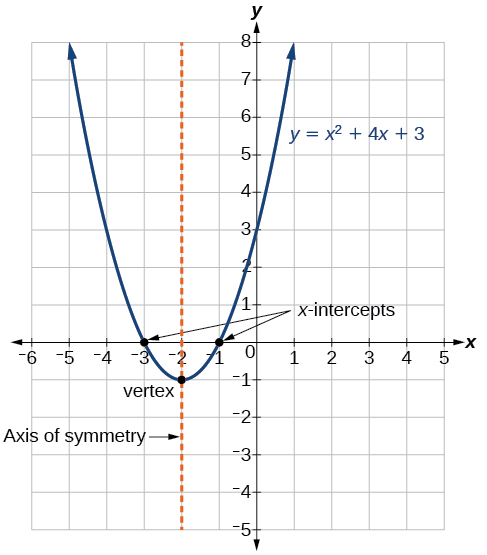
(Figure) represents the graph of the quadratic function written in general form as [latex]\,y={x}^{2}+4x+3.\,[/latex] In this form, [latex]\,a=1,b=4,\,[/latex] and [latex]\,c=3.\,[/latex] Because [latex]\,a>0,\,[/latex] the parabola opens upward. The axis of symmetry is [latex]\,x=-\frac{4}{2\left(1\right)}=-2.\,[/latex] This also makes sense because we can see from the graph that the vertical line [latex]\,x=-2\,[/latex] divides the graph in half. The vertex always occurs along the axis of symmetry. For a parabola that opens upward, the vertex occurs at the lowest point on the graph, in this instance, [latex]\,\left(-2,-1\right).\,[/latex] The [latex]\,x\text{-}[/latex] intercepts, those points where the parabola crosses the [latex]\,x\text{-}[/latex] axis, occur at [latex]\,\left(-3,0\right)\,[/latex] and [latex]\,\left(-1,0\right).[/latex]
The standard form of a quadratic function presents the function in the form
where [latex]\,\left(h,\text{ }k\right)\,[/latex] is the vertex. Because the vertex appears in the standard form of the quadratic function, this form is also known as the vertex form of a quadratic function.
As with the general form, if [latex]\,a>0,\,[/latex] the parabola opens upward and the vertex is a minimum. If [latex]\,a<0,\,[/latex] the parabola opens downward, and the vertex is a maximum. (Figure) represents the graph of the quadratic function written in standard form as [latex]\,y=-3{\left(x+2\right)}^{2}+4.\,[/latex] Since [latex]\,x–h=x+2\,[/latex] in this example, [latex]\,h=–2.\,[/latex] In this form, [latex]\,a=-3,h=-2,\,[/latex] and [latex]\,k=4.\,[/latex] Because [latex]\,a<0,\,[/latex] the parabola opens downward. The vertex is at [latex]\,\left(-2,\text{ 4}\right).[/latex]
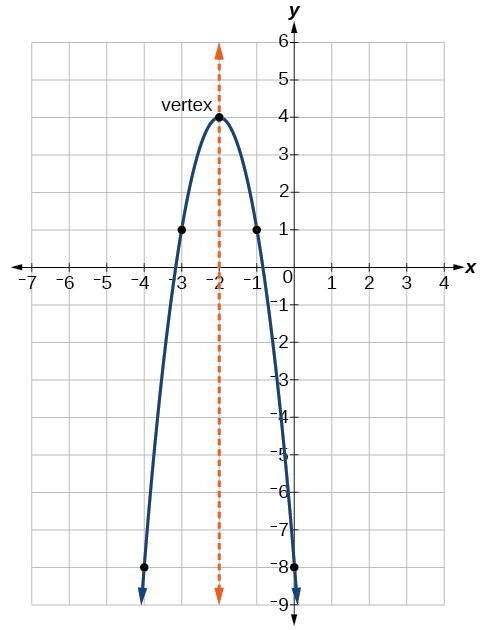
The standard form is useful for determining how the graph is transformed from the graph of [latex]\,y={x}^{2}.\,[/latex] (Figure) is the graph of this basic function.
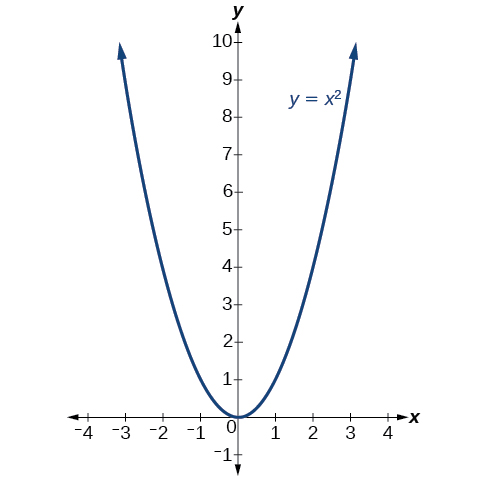
If [latex]\,k>0,\,[/latex] the graph shifts upward, whereas if [latex]\,k<0,\,[/latex] the graph shifts downward. In (Figure), [latex]\,k>0,\,[/latex] so the graph is shifted 4 units upward. If [latex]\,h>0,\,[/latex] the graph shifts toward the right and if [latex]\,h<0,\,[/latex] the graph shifts to the left. In (Figure), [latex]\,h<0,\,[/latex] so the graph is shifted 2 units to the left. The magnitude of [latex]\,a\,[/latex] indicates the stretch of the graph. If [latex]|a|>1,[/latex] the point associated with a particular [latex]\,x\text{-}[/latex] value shifts farther from the x-axis, so the graph appears to become narrower, and there is a vertical stretch. But if [latex]\,|a|<1,\,[/latex] the point associated with a particular [latex]\,x\text{-}[/latex] value shifts closer to the x-axis, so the graph appears to become wider, but in fact there is a vertical compression. In (Figure), [latex]\,|a|>1,\,[/latex] so the graph becomes narrower.
The standard form and the general form are equivalent methods of describing the same function. We can see this by expanding out the general form and setting it equal to the standard form.
For the linear terms to be equal, the coefficients must be equal.
This is the axis of symmetry we defined earlier. Setting the constant terms equal:
In practice, though, it is usually easier to remember that k is the output value of the function when the input is [latex]\,h,\,[/latex] so [latex]\,f\left(h\right)=k.[/latex]
Forms of Quadratic Functions
A quadratic function is a polynomial function of degree two. The graph of a quadratic function is a parabola.
The general form of a quadratic function is [latex]\,f\left(x\right)=a{x}^{2}+bx+c\,[/latex] where [latex]\,a,b,\,[/latex] and [latex]\,c\,[/latex] are real numbers and [latex]\,a\ne 0.[/latex]
The standard form of a quadratic function is [latex]\,f\left(x\right)=a{\left(x-h\right)}^{2}+k\,[/latex] where [latex]\,a\ne 0.[/latex]
The vertex [latex]\,\left(h,k\right)\,[/latex] is located at
How To
Given a graph of a quadratic function, write the equation of the function in general form.
- Identify the horizontal shift of the parabola; this value is [latex]\,h.\,[/latex] Identify the vertical shift of the parabola; this value is [latex]\,k.[/latex]
- Substitute the values of the horizontal and vertical shift for [latex]\,h\,[/latex] and [latex]\,k.\,[/latex] in the function [latex]\,f\left(x\right)=a{\left(x–h\right)}^{2}+k.[/latex]
- Substitute the values of any point, other than the vertex, on the graph of the parabola for [latex]\,x\,[/latex] and [latex]\,f\left(x\right).[/latex]
- Solve for the stretch factor, [latex]\,|a|.[/latex]
- Expand and simplify to write in general form.
Example 2 – Writing the Equation of a Quadratic Function from the Graph
Write an equation for the quadratic function [latex]\,g\,[/latex] in (Figure) as a transformation of [latex]\,f\left(x\right)={x}^{2},\,[/latex] and then expand the formula, and simplify terms to write the equation in general form.
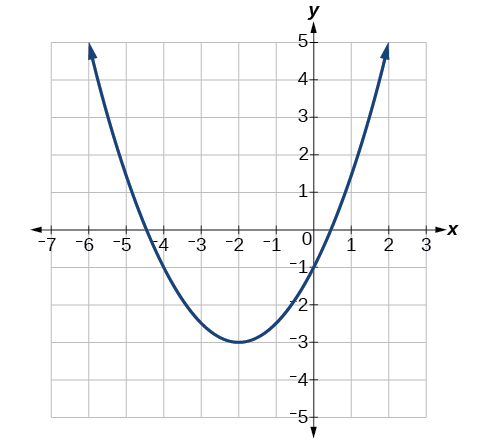
We can see the graph of g is the graph of [latex]\,f\left(x\right)={x}^{2}\,[/latex] shifted to the left 2 and down 3, giving a formula in the form [latex]\,g\left(x\right)=a{\left(x-\left(-2\right)\right)}^{2}-3=a{\left(x+2\right)}^{2}–3.[/latex]
Substituting the coordinates of a point on the curve, such as [latex]\,\left(0,-1\right),\,[/latex] we can solve for the stretch factor.
In standard form, the algebraic model for this graph is [latex]\,\left(g\right)x=\frac{1}{2}{\left(x+2\right)}^{2}–3.[/latex]
To write this in general polynomial form, we can expand the formula and simplify terms.
Notice that the horizontal and vertical shifts of the basic graph of the quadratic function determine the location of the vertex of the parabola; the vertex is unaffected by stretches and compressions.
Analysis
We can check our work using the table feature on a graphing utility. First enter [latex]\,\text{Y1}=\frac{1}{2}{\left(x+2\right)}^{2}-3.\,[/latex] Next, select [latex]\,\text{TBLSET,}\,[/latex] then use [latex]\,\text{TblStart}=–6\,[/latex] and [latex]\,\Delta \text{Tbl = 2,}\,[/latex] and select [latex]\,\text{TABLE}\text{.}\,[/latex] See (Figure).
| [latex]x[/latex] | –6 | –4 | –2 | 0 | 2 |
| [latex]y[/latex] | 5 | –1 | –3 | –1 | 5 |
The ordered pairs in the table correspond to points on the graph.
Try It
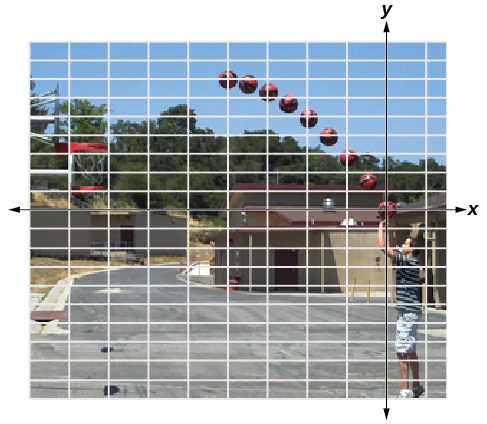
A coordinate grid has been superimposed over the quadratic path of a basketball in (Figure). Find an equation for the path of the ball. Does the shooter make the basket?
Show answer
The path passes through the origin and has vertex at [latex]\,\left(-4,\text{ }7\right),\,[/latex] so [latex]\,\left(h\right)x=–\frac{7}{16}{\left(x+4\right)}^{2}+7.\,[/latex] To make the shot, [latex]\,h\left(-7.5\right)\,[/latex] would need to be about 4 but [latex]\,h\left(–7.5\right)\approx 1.64;\,[/latex] he doesn’t make it.
How To
Given a quadratic function in general form, find the vertex of the parabola.
- Identify [latex]\,a, b, \text{and } c.[/latex]
- Find [latex]\,h,\,[/latex] the x-coordinate of the vertex, by substituting [latex]\,a\,[/latex] and [latex]\,b\,[/latex] into [latex]\,h=–\frac{b}{2a}.[/latex]
- Find [latex]\,k,\,[/latex] the y-coordinate of the vertex, by evaluating [latex]\,k=f\left(h\right)=f\left(-\frac{b}{2a}\right).[/latex]
Example 3 – Finding the Vertex of a Quadratic Function
Find the vertex of the quadratic function [latex]\,f\left(x\right)=2{x}^{2}–6x+7.\,[/latex] Rewrite the quadratic in standard form (vertex form).
First, observe that [latex]a=2, b=-6 \text{ and } c=7.[/latex] So, the horizontal coordinate of the vertex will be at [latex]$$ h= -\frac{b}{2a}=-\frac{(-6)}{2(2)}=\frac{6}{4}=\frac{3}{2}$$[/latex]
and, as a result, the vertical coordinate of the vertex will be at [latex]$$ k= f(h)=f\left(\frac{3}{2}\right)=2{\left(\frac{3}{2}\right)}^{2}–6\left(\frac{3}{2}\right)+7=\frac{5}{2}.$$[/latex]
Rewriting into standard form, the stretch factor will be the same as the [latex]\,a\,[/latex] in the original quadratic. First, find the horizontal coordinate of the vertex. Then find the vertical coordinate of the vertex. Substitute the values into standard form, using the ” [latex]a[/latex] ” from the general form.
The standard form of a quadratic function prior to writing the function then becomes the following:
Analysis
One reason we may want to identify the vertex of the parabola is that this point will inform us where the maximum or minimum value of the output occurs, [latex]\,k,[/latex] and where it occurs, [latex]\,x.[/latex]
Try It
Given the equation [latex]\,g\left(x\right)=13+{x}^{2}-6x,[/latex] write the equation in general form and then in standard form.
Show answer
[latex]g\left(x\right)={x}^{2}-6x+13\,[/latex] in general form; [latex]\,g\left(x\right)={\left(x-3\right)}^{2}+4\,[/latex] in standard form
Finding the Domain and Range of a Quadratic Function
Any number can be the input value of a quadratic function. Therefore, the domain of any quadratic function is all real numbers. Because parabolas have a maximum or a minimum point, the range is restricted. Since the vertex of a parabola will be either a maximum or a minimum, the range will consist of all y-values greater than or equal to the y-coordinate at the turning point or less than or equal to the y-coordinate at the turning point, depending on whether the parabola opens up or down.
Domain and Range of a Quadratic Function
The domain of any quadratic function is all real numbers unless the context of the function presents some restrictions.
The range of a quadratic function written in general form [latex]\,f\left(x\right)=a{x}^{2}+bx+c\,[/latex] with a positive [latex]\,a\,[/latex] value is [latex]\,f\left(x\right)\ge f\left(-\frac{b}{2a}\right),\,[/latex] or [latex]\,\left[f\left(-\frac{b}{2a}\right),\infty \right);\,[/latex] the range of a quadratic function written in general form with a negative [latex]\,a\,[/latex] value is [latex]\,f\left(x\right)\le f\left(-\frac{b}{2a}\right),\,[/latex] or [latex]\,\left(-\infty ,f\left(-\frac{b}{2a}\right)\right].[/latex]
The range of a quadratic function written in standard form [latex]\,f\left(x\right)=a{\left(x-h\right)}^{2}+k\,[/latex] with a positive [latex]\,a\,[/latex] value is [latex]\,f\left(x\right)\ge k;\,[/latex] the range of a quadratic function written in standard form with a negative [latex]\,a\,[/latex] value is [latex]\,f\left(x\right)\le k.[/latex]
How To
Given a quadratic function, find the domain and range.
- Identify the domain of any quadratic function as all real numbers.
- Determine whether [latex]\,a\,[/latex] is positive or negative. If [latex]\,a\,[/latex] is positive, the parabola has a minimum. If [latex]\,a\,[/latex] is negative, the parabola has a maximum.
- Determine the maximum or minimum value of the parabola, [latex]\,k.[/latex]
- If the parabola has a minimum, the range is given by [latex]\,f\left(x\right)\ge k,\,[/latex] or [latex]\,\left[k,\infty \right).\,[/latex] If the parabola has a maximum, the range is given by [latex]\,f\left(x\right)\le k,\,[/latex] or [latex]\,\left(-\infty ,k\right].[/latex]
Example 4 – Finding the Domain and Range of a Quadratic Function
Find the domain and range of [latex]\,f\left(x\right)=-5{x}^{2}+9x-1.[/latex]
As with any quadratic function, the domain is all real numbers.
Because [latex]\,a\,[/latex] is negative, the parabola opens downward and has a maximum value. We need to determine the maximum value. We can begin by finding the [latex]\,x\text{-}[/latex] value of the vertex.
The maximum value is given by [latex]\,f\left(h\right).[/latex]
The range is [latex]\,f\left(x\right)\le \frac{61}{20},\,[/latex] or [latex]\,\left(-\infty ,\frac{61}{20}\right].[/latex]
Try It
Find the domain and range of [latex]\,f\left(x\right)=2{\left(x-\frac{4}{7}\right)}^{2}+\frac{8}{11}.[/latex]
Show answer
The domain is all real numbers. The range is [latex]\,f\left(x\right)\ge \frac{8}{11},\,[/latex] or [latex]\,\left[\frac{8}{11},\infty \right).[/latex]
Access these online resources for additional instruction and practice with quadratic equations.
Key Equations
| general form of a quadratic function | [latex]f\left(x\right)=a{x}^{2}+bx+c[/latex] |
| standard form of a quadratic function | [latex]f\left(x\right)=a{\left(x-h\right)}^{2}+k[/latex] |
Key Concepts
- A polynomial function of degree two is called a quadratic function.
- The graph of a quadratic function is a parabola. A parabola is a U-shaped curve that can open either up or down.
- The axis of symmetry is the vertical line passing through the vertex. The zeros, or [latex]\,x\text{-}[/latex] intercepts, are the points at which the parabola crosses the [latex]\,x\text{-}[/latex] axis. The [latex]\,y\text{-}[/latex] intercept is the point at which the parabola crosses the [latex]\,y\text{-}[/latex] axis. See (Example 1), (Example 2), and (Example 3).
- Quadratic functions are often written in general form. Standard or vertex form is useful to easily identify the vertex of a parabola. Either form can be written from a graph. See (Example 4).
Glossary
- axis of symmetry
- a vertical line drawn through the vertex of a parabola, that opens up or down, around which the parabola is symmetric; it is defined by [latex]\,x=-\frac{b}{2a}.[/latex]
- general form of a quadratic function
- the function that describes a parabola, written in the form [latex]\,f\left(x\right)=a{x}^{2}+bx+c[/latex] , where [latex]\,a,b,\,[/latex] and [latex]\,c\,[/latex] are real numbers and [latex]\,a\ne 0.[/latex]
- roots
- in a given function, the values of [latex]\,x\,[/latex] at which [latex]\,y=0[/latex] , also called zeros
- standard form of a quadratic function
- the function that describes a parabola, written in the form [latex]\,f\left(x\right)=a{\left(x-h\right)}^{2}+k[/latex] , where [latex]\,\left(h,\text{ }k\right)\,[/latex] is the vertex
- vertex
- the point at which a parabola changes direction, corresponding to the minimum or maximum value of the quadratic function
- vertex form of a quadratic function
- another name for the standard form of a quadratic function
- zeros
- in a given function, the values of [latex]\,x\,[/latex] at which [latex]\,y=0[/latex] , also called roots
